Integrating
Statistics and Models Across the Social Sciences Curricula
A research project at
Virginia Tech
supported by
FIPSE,
US Department of Education, under grant #P116B60201
ABSTRACT-- Faculty from the Social Sciences and Computer Science
will produce computerized course materials that promote understanding and
appreciation of statistics and mathematical models among undergraduate
students in the social sciences. Our goal is to integrate statistical methods
throughout the curricula, rather than isolate student contact with statistics
to one or two courses as is common today. This will help students understand
the role of statistics in the evaluation of hypotheses, and help students
apply analytical thinking skills to claims of fact presented to them in
their everyday lives. We will create an integrated courseware package including
significant social science databases, visualization and analysis tools,
and multimedia tutorials on statistical techniques and the role of models.
The courseware will be flexible in that it will contain data suitable for
use in a broad range of courses in the social sciences, and also allow
students to import their own data. It will allow instructors to demonstrate
particular statistical techniques or use those techniques to present information
relevant to that class. Our courseware will also form a vehicle for integrating
statistical material across courses within departments, and across departments
within the University. The software will be created using Mathematica,
a widely used mathematical software system. We will collaborate on this
project with Wolfram Research, Inc., the creators of Mathematica.
We aim to create an instructional package that will be used throughout
the country in a variety of social sciences curricula, initially in geography,
psychology and sociology.
CONTENTS
Project
Narrative
The Problem
Much social science research today involves testing hypotheses through
statistical analysis of quantitative data. Thus, understanding and assessing
conclusions made in the social sciences requires a familiarity with basic
statistical techniques. Social sciences also make extensive use of mathematical
models. Unfortunately, most college students reach graduation without a
practical understanding of basic statistical techniques and the concept
of a mathematical model. They often have little working knowledge of scientific
methods. Such basics of statistical and scientific reasoning are not abstract
concepts irrelevant to everyday experience. Rather, a misunderstanding
of these basics has led to a citizenry that is largely unable to assess
the validity of claims of fact presented in statistical form, or purporting
to come from mathematical models. Such "facts" appear daily in
newspapers, advertisements and political speeches.
Most social science curricula include a course in basic statistics, often
as preparation for a course in research methods intended to give the student
practical experience in creating and testing scientific hypotheses. The
main problem does not seem to us to be in the content or quality of the
initial statistics course. Rather, most students see little or no connection
between the required statistics course and the rest of their curriculum.
Nor do they see any connection between statistics and their ability to
be critically analyze information outside the academic setting.
Goals and Objectives
Our goal is that students understand the role of statistics in the scientific
evaluation of hypotheses. We would like students developing hypotheses
to know how to apply statistical techniques to evaluate these hypotheses.
Likewise, when a student is presented with a statement of "fact,"
we want the student to be able to test whether that statement is supported
by available data.
A coalition of faculty from three Social Sciences departments and the Department
of Computer Science at Virginia Tech will produce course materials that
promote understanding and appreciation of statistical and mathematical
models among undergraduate students taking courses in the social sciences.
The integrating concept will be models: what they are, why we use them
and the underlying mathematics that drive them. These models will be developed
with sufficient depth and flexibility to allow us to integrate statistical
methods throughout the social science curricula, rather than isolate student
contact with statistics to one or two courses.
The work outlined in this proposal will address some of the most basic
problems in the teaching of statistics and quantitative methods to undergraduates
in the social sciences. Presentation of statistical material is often concentrated
in a single course, where it is detached from the subject matter context
in which statistical concepts could be most clearly presented, and seen
to be most powerful. Confining this material to one or two courses creates
the impression that statistical concepts are somehow detached from the
concepts most basic to a discipline, rather than essential components.
This separation is usually caused not by a lack of faculty expertise or
interest as much as it is by a lack of effective teaching resources that
permit instructors to present statistical material without lengthy digressions
from immediate topics. Our effort will create a system with the flexibility
to present relevant examples and concepts tailored to the specifics at
hand, designed to minimize the effort required to use the package, and
maximize flexibility to permit use with a variety of data, both in classroom
and in laboratory contexts. By providing these capabilities, we hope that
our work will lead to changes in curriculum, such that within courses,
statistical material will be more effectively integrated with subject matter
issues, that within departments, statistical concepts can be presented
in a wider variety of courses, and within the university, that there will
be greater collaboration among faculty in different disciplines. Virginia
Tech is not unusual in its desire to become more cost effective through
reducing redundancy in courses. By increasing cross-disciplinary collaboration,
this project will help in such efforts.
Potential Impact and Significance
By targeting the mathematical content of courses in the social sciences,
we have a unique opportunity to greatly influence the understanding of
mathematical models by a broad population of students. Social science courses,
at all levels of the curriculum, naturally touch upon many models of complex
systems. However, traditionally these courses have not stressed the importance
of models, or quantitative aspects in general. One reason is that traditional
classroom settings do not make it easy for students to interactively manipulate
quantitative data. Fortunately, modern instructional technology provides
an opportunity to provide sophisticated presentations of models and analysis
techniques through interactive simulations and visualizations, multimedia
presentations, use of computers to illustrate dynamic processes during
lecture, and desktop publishing of new course materials.
Procedure and Methods
The Project-- Our efforts will focus on creating an integrated
software package including tutorials, visualization and statistical analysis
tools, and supporting course materials. The system will be organized around
two major databases and a selection of smaller databases that together
contain data relevant to all of the social sciences involved. One database
will be the General Social Survey (GSS), an annual survey of individuals
which includes demographics (race, marital status, age, occupation, etc.)
and hundreds of other items related to attitudes and behavior. The second
database will be derived from Census Bureau information, including the
1990 census and the most recent City/County Data Book, which provides aggregate
data at the county level for the United States. Finally, quasi-experimental
and experimental databases will be selected from the Inter-University Consortium
for Political and Social Science. Together, these databases provide a resource
broad and deep enough to allow students to perform interesting class assignments,
gain experience and confidence with research methods, and simply explore
data to satisfy their own curiosity. In addition, we will provide support
for students entering, analyzing and visualizing their own databases.
We will create multimedia tutorials that teach the statistical techniques
and modeling issues relevant to most social sciences curricula. Students
can be introduced to the database in one course, and subsequently build
on their understanding to do more sophisticated analysis in later courses.
For example, students in introductory courses may focus on what the database
tells us about the behavior of people, while students in a research methods
class might focus on choices of statistical techniques. The interdisciplinary
character of the development team will promote greater collaboration and
co-ordination between the curricula of the several departments, and lead
to reinforcement of concepts.
Our instructional system must integrate three components. The database
component will be derived from the various databases listed above,
edited and reformatted as appropriate. The second component is an analysis
system which allows flexible access to the databases, a wide range
of statistical analysis on the selected data, and visualization of the
results of the analysis. The third component is a multimedia tutorial
on statistical techniques and the role of models. In addition, our
project will produce a set of manuals, instructional aids and classroom
exercises to support the software.
Our intention is for the courseware to be flexible and applicable in a
number of instructional settings. In particular, it will not be a monolithic
instructional course. Instead, students will be able to use the system
to learn about and a apply a particular statistical function or analysis
technique. Users will be able to apply the visualization tools to solve
their particular problems. Instructors will be able to use the courseware
to illustrate a particular point in class, or assign a small project using
the courseware even if they choose not to make it a central part of the
class.
The Role of Mathematica-- To create the system we envision, we
must be able to integrate the three components of database, analysis and
visualization tools, and online instructional material. We have considered
implementing the entire system from scratch (actually, built on our existing
software libraries created as part of Project GeoSim) [GIL94, GeoSim].
However, this would require re-implementing standard statistical analysis
functions and an instructional presentation package. An alternative is
to base the system on an existing statistical package such as SPSS or SAS.
Unfortunately, these systems are rather inflexible outside their domain
of statistical analysis, and have inadequate support for instructional
presentations. Tutorial material could be created in a separate authoring
system such as Authorware, but this leads to two major difficulties regarding
integration. First, the students must alternate between the tutorial presentation
and the analysis package: the two modes cannot be combined because the
software supporting these two parts of the system does not allow it. Second,
the programming team must keep the content of two separate systems synchronized
during development, which is difficult if there is no connection supported
by the development software. A more manageable approach, and the one we
propose, is to use a package that provides a good compromise regarding
ability to support all of the components required by our project.
Our solution is to base our project on the widely used Mathematica
system from Wolfram Research, Inc [Wolf91]. Mathematica contains
all of the necessary statistical analysis functions, and has excellent
support for graphics. Since it includes a complete programming language,
we can implement the database processing portions of the system directly
within Mathematica. The system is also flexible enough to support
programming of the visualization techniques described in the next section.
Mathematica incorporates an interface for instructional material,
called a "notebook." Notebooks provide a hierarchical organization
of instructional material so that students can begin with a table of contents
and expand those sections of interest. The statistical analysis functions
are incorporated directly into the instructional presentation, so that
students can examine the abilities of the techniques on actual data sets
in a controlled manner. The interface will be designed so that students
need no prior knowledge of Mathematica to use our courseware.
Finally, the resulting courseware will be able to run on all platforms
supported by Mathematica, including MS-Windows, MacOS and UNIX.
The Role of Visualization-- Most statistical techniques, while
implemented as mathematical formulae, have simple, intuitive interpretations.
However, developing that intuition often requires that the technique be
expressed in a visual manner. Likewise, relationships in data such as correlation
and regression are often best spotted by humans through appropriate visualization
techniques. Over the past few decades, visualization techniques for statistics
have become increasingly important to scientists. The work of pioneers
such as Tukey, Cleveland and Tufte [Tukey77, Cleve93, Tufte83] has been
combined with the rise of computer graphics capabilities, resulting in
many high-end scientific visualization systems. We believe it is time to
harness the best of this technology for use in education. Note that this
does not necessarily mean that sophisticated computational facilities is
required. Charts, scatter plots and special purpose techniques such as
the creative use of Venn Diagrams to visualize the concept of correlation
[KB94] are popular. They convey the statistical concepts to the students,
as well as forming analysis tools in their own right.
As an example of the power of visualization in statistical instruction,
consider a small number of outliers which result in a Pearson correlation
coefficient that differs appreciably in magnitude or even in sign from
Spearman's rho for the rank order relationship for the same data. Understanding
each of these measures of association and choosing between them is facilitated
by scatter diagrams showing raw scores and ranks in which students see
for themselves how Pearson's r may be affected by outliers and how Spearman's
rho fails to distinguish between trivial and substantial difference between
adjacent pairs of scores. Through such visualization, students will gain
the experience needed to make informed choices when doing analyses for
their own projects.
Effective visualization techniques are also important to allow understanding
of data relationships within large, complex databases such as the GSS and
Census databases to be incorporated in this project. Each of these databases
contain thousands of records with hundreds of variables per record. We
intend to take advantage of advanced visualization techniques that are
becoming standard practice within the research community, but which are
not now commonly used at the undergraduate level.
As part of our work for Project GeoSim, we developed a data browser
for a county information database [Hines95]. This has given us experience
with visualization techniques appropriate for the proposed project. To
illustrate such techniques, we present three "views" for county
data in Figures 1 to 3.
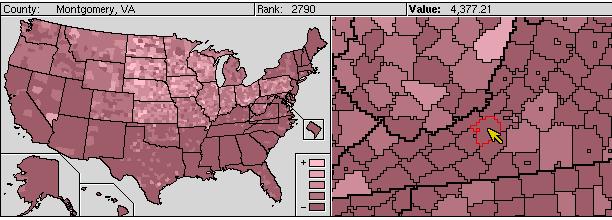
Figure 1: Visualization of spatial data via a map view.
Figure 1 shows a map view. The left side shows a map of the entire U.S.
The right side shows an expanded view for a part of the country selected
by the user. Counties are shown colored based on the quintile of the value
or rank of the county under some variable (either a raw variable stored
in the database, or a derived quantity). The map view provides a basis
for understanding spatial effects.
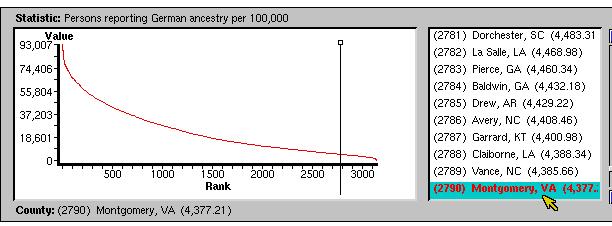
Figure 2: Visualization of data distribution via a
graph view.
Figure 2 shows a graph plotting the distribution of the same variable.
This display illustrates distribution effects that may not be clear under
the map view. Effects of distribution on statistical relationships are
an important concept for the student to learn.
Figure 3 shows a spreadsheet view, which helps the user browse multiple
variables for a record. Figure 4 illustrates the advanced visualization
technique called "parallel coordinates," [Ward94] which allows
for visualization of relationships such as correlation among multiple variables
in a large database. Each column corresponds to a variable, sorted by value.
The lines link the position of a particular record among the columns. The
visual pattern presented by the lines provides information regarding correlation
or reverse correlation. For example, to the extent that the lines show
few intersections between two columns, there is visual indication that
the variables positively correlated.
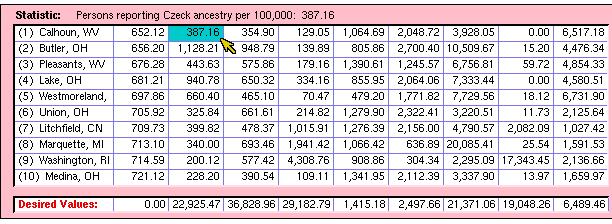
Figure 3: Visualization of multiple variablesvia
a spreadsheetview.
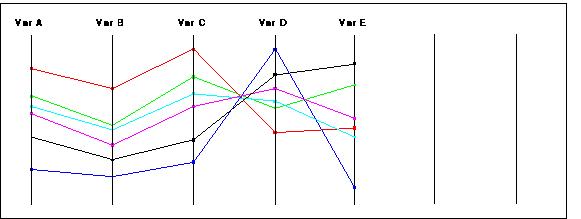
Figure 4: The visualization technique known as "parallel
coordinates." Variables A, B and C appear correlated, as
shown by few intersections. Variables C and D appear inversely correlated,
as shown by many intersections near the same point. Variables D and E show
little correlation.
Alternatives-- There currently exist many systems for doing basic
statistics, many easily understandable by undergraduates. Examples include
SAS, SPSS, Stata and Statistica. While good at what they do (namely, allow
for statistical calculation), they are not well suited for instructional
presentation or visualization of large databases. There also exist special
purpose systems for examining databases such as the 1990 Census or the
GSS. There even exist computerized tutorials meant to teach basic statistical
techniques. However, there is no comprehensive, integrated software package
that combines significant and relevant social science databases with strong
statistical processing power and advanced data visualization techniques
suitable for classroom use at the undergraduate level. We will provide
such a package, closely integrated with computer tutorials on statistical
techniques and classroom exercises.
Impact on Selected Curricula
This section comments on how the proposed software would be used in
the three social sciences departments represented by the Principal Investigators
of this proposal. It also serves to point out how the departments differ
in their approaches to data analysis in particular and research methods
in general.
Sociology-- In Sociology, research methods rely heavily on survey
work and post hoc analysis. Students need the ability to compare data and
find correlations. The result of their analysis is often descriptive in
nature. Sociologist work with both group and individual differences. While
the GSS data are directly relevant to Sociologists, the Census database
will also prove to be a value resource.
Our Sociology faculty are presently reviewing whether to increase the number
of credit hours for our Sociological Research Methods course from 3 to
4. We realize that the sheer volume of material covered in that course
requires more time and effort than normally associated with 3-hour courses.
The proposed courseware can further strengthen the Research Methods course.
It will also allow us to place the Research Methods course earlier in the
curriculum since the material will be easier for students to comprehend.
In this way, students will gain familiarity with both the courseware and
the research methods earlier, allowing us to use these techniques more
fully in later classes.
Numerous courses in Sociology lend themselves to adoption of the proposed
courseware. At the undergraduate level these courses include the following.
- Demography and Rural Sociology: each examines shifts
in populations, a subject also of interest in Geography.
- Social Stratification, Minority Group Relations and Sociology
of Religion focus on various measures and correlates of social class,
groups and trends in belief, respectively.
- Many other courses (Social Problems, Deviant Behavior,
Criminology) examine cross-sectional and longitudinal data.
Psychology-- In contrast to Sociology, research methods in Psychology
tend to be experimental or explanatory in nature. The approach is generally
to form a hypothesis and then design a study or search a database to determine
the validity of the hypothesis. Psychological research also tends to focus
on individual differences. Both the GSS and Census databases will be useful
to some degree to Psychology students. However, more than for the other
departments, students and instructors will need the ability to enter their
own databases, or use the specialized experimental and quasi-experimental
databases provided with the courseware.
Two recurring problems with psychology majors is that many have little
understanding of the relationship between psychological research and statistics,
and are not readily able to apply statistical principles to research problems.
One reason is that the required statistics and research methods courses
are not formally integrated when students take these courses in their Sophomore
year. Instead, students are expected to integrate and apply statistics
and research methods when they take the senior-level psychology courses
that require completion of a research project.
The courseware will allow instructors to actively reinforce the understanding
of statistics and research methods in the content courses taken prior to
the senior-level courses. Instructors will be able to simultaneously demonstrate
the relationship between statistics and research methods. Instructors can
enter data sets of their choosing to compliment the content areas covered
in lecture. In doing so, instructors can increase understanding and retention
of statistics and research methods, and better prepare students for the
senior-level application courses. When our majors reach their senior-level
research courses, they will already be able to use the courseware to visualize
and analyze their data.
Some relevant courses in Psychology include:
- Social Psychology: this will make heavy use of the GSS and Census
databases.
- Industrial Psychology: covers issues such as selecting employees,
employee attitudes and job satisfaction. The GSS database contains information
relevant to some of these issues.
- Courses such as Abnormal Psychology and Developmental Psychology
will focus more heavily on experimental and quasi-experimental databases.
- Psychology of Personality focuses on differences in individual
behavior, and will be well served by allowing students and instructors
to input their own databases.
Geography-- Statistical practice in Geography tends to concentrate
on post hoc approaches to data analysis. Thus, a student or researcher
will wish to search a database to reveal interrelationships among variables.
In contrast to Sociology and Psychology, analysis in Geography often concentrates
on aggregate data. The US Census database is clearly ideal for study by
Geography students.
Our Geography faculty has a long-standing commitment to teach statistical
applications throughout its curriculum. Geography majors are required to
take the statistics course in social science applications offered by the
statistics department. Unlike the other departments, Geography majors do
not take a separate Geography course devoted to statistical research methods.
Distributing research methods topics throughout the Geography curriculum
has been slowed by the absence of a convenient, flexible vehicle for presenting
this material in a variety of formats, by faculty with differing interests
and perspectives. The proposed courseware will address this problem.
While statistical topics are applicable to most Geography courses, the
following provide good examples.
- Medical Geography: students must understand how epidemiology
examines interrelationships between environmental and demographic components
to isolate the effects of disease.
- Courses in Cartography and Geographic Information Systems
examine questions of defining and characterizing regions based on interrelationships
between sets of variables.
- Physical Geography introduces students to issues arising from
variability of weather and climate data. In Geomorphology, students
apply statistical concepts in the analysis of terrain, of streamflow data,
and measurement error.
- Human Geography courses examine demographic and economic differences
across and within nations and regions.
Institution and Investigators'
Background
This proposal was created by a team of faculty from four separate departments.
Together, we have extensive expertise in developing and evaluating educational
software, a variety of quantitative methods in the Social Sciences, and
educational outcome evaluation. Cliff Shaffer was Project Director for
Project GeoSim, jointly sponsored by FIPSE and NSF and winner of
an Ames Undergraduate Computational Science Education Award. GeoSim
consists of several simulations and tutorials for use in introductory geography
classes. John Carroll is a widely known expert in Human Computer Interaction,
with extensive experience designing and evaluating help and instructional
systems. Jim Campbell, Neil Hauenstein and Bradley Hertel represent discipline-specific
expertise in Geography, Psychology and Sociology, respectively. They each
have extensive experience with teaching quantitative methods and research
skills in the social sciences. In addition, Dr. Hauenstein has experience
with academic outcome assessment and evaluation of intervention projects
in the private sector.
Virginia Tech is currently in the third year of a four year initiative
to provide all our faculty with personal computers suitable for a wide
range of multimedia and instructional technology. Another part of this
initiative is a major effort to install computers and the necessary projection
equipment in all classrooms to support CAE presentations. Already, five
classrooms have been converted into special labs where each student has
a computer at his or her desk to allow for interactive educational exercises.
Thus, Virginia Tech has a demonstrated, continuing commitment to computer
aided instructional technology.
Wolfram Research, Inc. (WRI), the creators of Mathematica, have
agreed to provide considerable support for this project. Their personnel
will provide expert assistance as we design and program the system. They
will also provide summer internships for our personnel at their facilities
in Champaign, IL. This will allow for increased collaboration between Virginia
Tech and WRI. WRI will also aid in project dissemination (see
below).
Statistical Content
We currently plan for the following statistical content to be included
in the system.
- Levels of data and central tendency
- categorical, ordinal, interval, ratio data
- precision versus accuracy
- measures of central tendency
- situations in which measures of central tendency are the same and other
situations in which they are different
- Dispersion and distributional characteristics
- measures of dispersion including range, variance and standard deviation
- percentile, quartile, etc.
- skewness and kurtosis
- normal distribution
- z-score
- Sampling
- Central limit theorem; standard error
- Random sample versus probability sample
- Nonprobability sampling: purposive, convenience, quota, snowball
- Drawing inferences about two means
- sample mean versus population mean
- comparing two sample means
- Type I and Type II errors
- z- and t-tests: one tailed versus two tailed
- Testing for significant relationship between and among categorical
variables
- Chi-square analysis
- capacity of Chi-square to be used in directional tests when both variables
are dichotomies
- use of control variables with Chi-square
- Analyzing strength of association between categorical and ordinal
variables
- marginal constraints
- absolute association versus complete association
- computational alternatives (e.g., phi, gamma, etc)
- conditional odds and odds ratios
- Analysis of variance: analyzing relationship between and among ordinal
or continuous dependent variables and dichotomous or categorical independent
variables
- one-way; t distribution; F distribution
- wo-way \item interaction effects
- Multiple Classification Analysis
- unadjusted and adjusted means
- eta and beta
- Bivariate regression and correlation
- Spearman's rho for rank-order variables
- Pearson's r and its assumptions; compare with rho
- coefficient of determination
- scatter plots and regression lines: b and a; beta
- correlation matrices
- Multiple regression analysis
- concept of a regression plane in multivariate analysis
- raw versus standardized multiple regression coefficients: when to use
each
- multiple R and R-squared
- partial r
- dummy variables
- analysis of covariance
- path analysis
Evaluation
For this project we need to evaluate both the "usability"
of the software and also its "learning efficacy" [CR]. With respect
to usability, the software must convey and facilitate tasks and operations
that the user wants to accomplish; it must provide appropriate feedback;
it must evoke and sustain the user's motivation, it must support error
recognition, diagnosis and recovery. With respect to learning efficacy,
the experience of using the software must effectively guide problem-solving
and learning. Software can be attractive, pleasant, and productive but
fail to stimulate effective learning and retention. Conversely, it can
incorporate good educational content and yet be too difficult or unpleasant
to use.
Scriven's monograph on curriculum evaluation emphasized the contrast between
pay-off and intrinsic evaluation [Scri67]. Measuring task times and error
rates are examples of pay-off evaluation. Enumerating and analyzing the
design features of a tutorial package would be an intrinsic evaluation.
Scriven observed that pay-off evaluation often produces solid facts with
indeterminate causal interpretations. Intrinsic evaluation produces detailed
interpretations of features, rationale, and tradeoffs but often with little
empirical grounding. Scriven urged that the two approaches be combined:
intrinsic evaluation can guide the detailing of pay-off evaluation plans
and the interpretation of results [CR].
Scriven's monograph also originated the distinction between summative and
formative evaluation. Summative evaluation seeks to gauge a design result,
while formative evaluation seeks to identify aspects of a design that can
be improved. These three distinctions (usability/learning efficacy, formative/summative
evaluation, pay-off/intrinsic evaluation) define a comprehensive evaluation
space for instructional software. Our evaluation plan attempts to address
this entire space.
Formative evaluation-- The first phase of evaluation involves
documenting and guiding development of the project from the perspective
of users. Our approach will integrate intrinsic and pay-off methods, in
a style Scriven called "mediated" evaluation [Scri76]. We have
employed this approach to formative evaluation in prior instructional development
projects [CSR].
Intrinsic evaluation. As the databases and software tools
are developed, we will create and maintain an explicit design rationale
for the system [MC96]. We will enumerate the typical and critical tasks
and scenarios to be supported by the system for students and instructors,
for example, the what-if scenario in which a student has worked through
an analysis project using an installed data set and wishes to edit the
data set and repeat that analysis. We will analyze the potential user consequences
for key system features and relationships within each scenario context.
For example, allowing learner-initiated what-if explorations enhances motivation
and depth of cognitive processing, but also increases the variety and severity
of errors (which in turn complicates the tutorial and help-system).
This design rationale is our intrinsic evaluation and will serve as a formative
planning aid, helping to keep considerations of usability and learning
efficacy in view from the very inception of the work. For example, the
what-if scenario mentioned above suggests that users be able to run two
(or more) analyses at once to compare results.
Pay-off evaluation. We will also use the design rationale
to guide and interpret pay-off formative evaluations. For example, classifying
a sequence of learner actions as an instance of what-if exploration will
engage our analysis of that type of scenario in interpreting the observed
events. Later in the project, the design rationale will be used as an issue
base to create summative pay-off evaluations that comprehensively assess
the key design features and usage scenarios of our software [CR].
Our main pay-off evaluation method in the formative evaluation phase will
be thinking-aloud [NS72]. This method consists of systematic, non-directive
prompting during learning activities to encourage learners to articulate
their plans and concerns while these are still actively being pursued,
and to clarify the basis for specific actions they undertake. We have extensive
experience with this approach to formative evaluation.
Summative Evaluation-- A large part of the summative pay-off
evaluation will involve assessments of students and faculty using the courseware.
The evaluation criteria for this phase of the project can be classified
into immediate and long-term measures. Immediate criteria refer to those
evaluations occurring during or shortly after use of the courseware. Long-term
criteria refer to measures collected one or more years after implementation.
Immediate Criteria-- Reaction Measures. Reaction
criteria are used to assess attitudes about the learning intervention [Gold].
Two types of reaction measures will be developed. First, general reaction
measures will be developed to assess both student and faculty attitudes
about the classes using the courseware. Data will be collected on these
general reaction measures both before (baseline) and after (post-intervention)
the courseware is implemented. The comparison between baseline and post-intervention
general reactions will indicate the effect that the courseware had on general
beliefs about the course, student satisfaction when taking the courses
using the courseware, and faculty satisfaction about using the courseware.
Second, specific reaction questionnaires will be developed to measure both
student and faculty attitudes about the courseware. Responses to specific
reaction questionnaires will be collected only in classes using the courseware.
The focus of these specific reaction questionnaires will be satisfaction
levels associated with specific features of the courseware. These data
can be used as formative measures to assist with decisions about modifications
to the courseware after initial implementation.
Learning Measures. Learning criteria are used to assess the
extent to which students acquire the learning objectives targeted by the
intervention. Such criteria must be objective and quantifiable indicants
of learning. The learning criterion developed for this project will be
a content-valid standardized achievement test designed to measure knowledge
of the statistical principles fundamental to the behavioral sciences. This
test will be designed to be used across all social science disciplines
involved in the project. Prior to implementation of the courseware, baseline
knowledge data will be collected by administering the test in classes targeted
for future use of the courseware.
In subsequent semesters, post-intervention performance on the statistical
principles test will be collected in classes using the courseware. Comparisons
of baseline knowledge to post-intervention knowledge will indicate the
extent to which the courseware affected initial learning of statistical
principles.
Long-Term Criteria-- The completion of a long-term evaluation
of the courseware is not possible under the proposed three year schedule.
Nonetheless, baseline data necessary for a long-term evaluation of the
courseware will be collected with intention of completing the evaluation
after the FIPSE grant expires.
Retention Measures. Ultimately, a major goal of the courseware
is to increase the statistical sophistication of behavioral science graduates.
In order to assess our success on this goal, the retention of the statistical
knowledge of graduating seniors will be measured both before and after
implementation of the courseware. Statistical knowledge will be measured
using an alternative form of the statistical knowledge test described above.
During the time the courseware is being developed and implemented, baseline
data will be collected from graduating seniors who have not used the proposed
courseware.
Two years after implementation of the courseware, post-intervention performance
of graduating seniors will be assessed. If post-intervention performance
is better than baseline performance, then this suggests the courseware
was helpful in increasing the statistical sophistication of behavioral
science graduates.
Curriculum Revision. A second major goal of the courseware
is to affect the behavioral science curricula. To assess this goal, post-intervention
modifications to departmental curricula requirements will be monitored.
Interviews will be conducted with the relevant faculty to determine the
role of the courseware in stimulating any curricula revisions. Also, baseline
syllabi will be collected from courses targeted for implementation of the
courseware. These baseline syllabi will be compared (within instructor)
to syllabi used after implementation of the courseware. Instructors who
modify their syllabi after implementation of the courseware will be interviewed
to determine the effect of the proposed courseware on course revisions.
Independent Evaluation-- To insure that our materials are applicable
to a wider audience than Virginia Tech, and to serve as an independent
check on our summative evaluation, we will recruit members of the corresponding
Social Science departments at nearby Radford University. Radford is primarily
a four-year, teaching-oriented University, and so provides some diversity
to contrast with Virginia Tech. We successfully worked with faculty at
Radford during Project GeoSim. While the details have not been completed,
we include a letter from one faculty member to show that we have begun
the process. A part of our budget is allocated to support Radford faculty.
Dissemination of Results
The software resulting from this project will be available via the Internet,
both from our site and from MathSource, WRI's Internet distribution for
Mathematica related software. WRI has also agreed to distribute
the software as part of MathSource on CD-ROM. The software will be demonstrated
at a variety of conferences, including discipline specific conferences
and meetings on educational technology.
Based on our successful experience with disseminating Project GeoSim software,
we believe that we have a demonstrated ability both to produce software
of value to a wide educational community, and to distribute it effectively.
Schedule
Fall 1996
- Develop and pilot test general reaction measures and achievement test
for statistical principles (baseline studies).
- Collect syllabi from courses targeted for future use of courseware.
- Develop usage scenarios and design rationale based on student baselines,
course syllabi, and prototypes of databases and tools.
- Compile and format the target databases, integrating them with Mathematica.
- Create a preliminary design for the visualization tools.
Spring 1997
- Prototype the basic visualization tools used to browse the databases.
- Revise general reaction measures and achievement tests.
- Conduct final pilot test of general reaction measures and achievement
tests.
- Thinking-aloud formative evaluations of prototype databases and tools.
- Exit interviews with graduating seniors (baseline study).
Summer 1997
- Integrate the visualization tools, basic statistical capabilities and
the databases to form an initial prototype for the system.
- Design the tutorial interface.
- Develop courseware specific reaction measures.
Fall 1997
- Implement the tutorial interface and integrate with the visualization
system.
- Pilot test courseware specific reaction measures in courses using earliest
versions of courseware.
- Collect general reaction data and achievement test data in courses
targeted for future use of the courseware.
- Develop and pilot alternative forms of achievement test for statistical
knowledge.
- Collect syllabi from courses targeted for future use of courseware.
- Iteratively refine scenarios and design rationale based on further
baseline studies, course syllabi, and development of databases and tools.
- Continue thinking-aloud formative evaluations.
Spring 1998
- Complete initial courseware system including some of the tutorial content.
- Collect general reaction data and achievement test data in courses
targeted for future use of courseware.
- Collect achievement test (retention) data for graduating seniors.
- Collect syllabi from courses targeted for future use of courseware.
- Exit interviews with graduating seniors (refine baseline study).
Summer 1998
- Redesign and reimplement courseware system as necessary, based on feedback
from formative evaluation.
- Analyze specific reaction data and provide feedback to courseware designers.
- Work with Radford faculty to plan testing at Radford.
Fall 1998
- Collect general reaction data, specific reaction data and achievement
test data in courses using the courseware.
- Collect syllabi from courses using the courseware.
- Complete tutorial content.
- Pilot test evaluation at Radford.
Spring 1999
- Major semester for in-class experiments.
- Collect general reaction data, specific reaction data and achievement
test data in courses using the courseware.
- Collect achievement test data for graduating seniors not exposed to
the courseware.
- Collect syllabi from courses using the courseware.
- Conduct exit interviews with graduating seniors (students in transition).
- Collect data from Radford.
Summer 1999
- Analyze all baseline--post-intervention comparison data.
- Write evaluation report on immediate evaluation criteria.
Continuing after grant
- Conduct exit interviews with graduating seniors (post-intervention
students).
References
[CR] J.M. Carroll and M.B. Rosson, Managing evaluation goals
for training, to appear in Communications of the ACM, July 1995.
[CSR] J.M. Carroll, M.K. Singley and M.B. Rosson, Toward an architecture
for instructional evaluation in Proceedings of the 1991 International
Conference on the Learning Sciences, L. Birnbaum, Ed., Association
for the Advancement of Computing in Education, Charlottesville VA, 1991,
85-90.
[GeoSim] L.W. Carstensen, Jr., C.A. Shaffer, R.W. Morrill and E.A.
Fox, GeoSim: A GIS-based simulation laboratory for introductory
geography, Journal of Geography 92, 5(Sep/Oct 1993), 217-222.
[Cleve93] William S. Cleveland, Visualizing Data, AT&T
Bell Laboratories, Murray Hill, NJ, 1993.
[Gold] I.L. Goldstein, Training in Organizations, Brooks/Cole
Publishing, Pacific Grove CA.
[GIL94] D.T. Hines, J.M.A. Begole, C.A. Klipsch and C.A. Shaffer,
The GeoSim Interface Library (GIL): Programmer's Manual, Computer
Science TR 94-31, VPI\&SU, December 1994.
[Hines95] D.T. Hines, Computerized Simulations for Geography
Instruction: Sense of Place, Master's Project Report, Virginia Tech,
Blacksburg VA, 1995.
[KB94] D. Knoke and G.W. Bohrnstedt, Statistics for Social Data
Analysis, 3rd Ed., F.E. Peacock, Itasca IL, 1994.
[MC96] T.P. Moran and J.M. Carroll, Design Rationale: Concepts,
Techniques, and Use, Lawrence Erlbaum Associates, Hillsdale, New Jersey,
1996.
[NS72] A. Newell and H.A. Simon, Human problem solving, Prentice-Hall,
Englewood Cliffs, New Jersey, 1972.
[Scri67] M. Scriven, The methodology of evaluation, in Perspectives
of curriculum evaluation, R. Tyler, R. Gagne and M. Scriven, Eds. Rand
McNally, Chicago, 1967, pp. 39-83.
[Tukey77] John W. Tukey, Exploratory Data Analysis, Addison-Wesley,
Reading, MA, 1977.
[Tufte83] E.R. Tufte, The Visual Display of Quantitative Information,
Graphics Press, Cheshire CT, 1983.
[Ward94] M.O. Ward, XmdvTool: Integrating Multiple Methods for Visualizing
Multivariate Data, in Proceedings of Visualization'94, Washington,
DC, October 1994, 326-333.
[Wolf91] S. Wolfram, Mathematica: A System for Doing Mathematics
by Computer, 2nd Edition, Addison-Wesley, 1991.
Table of Goals
|
GOAL
|
EVALUATION
|
| Improve statistical comprehension of students |
Compare baseline studies to outcomes using learning measures |
| Greater retention of statistical knowledge |
Compare graduating students in current courses to graduating students
in revised courses on retention measures |
| Improve students' ability to apply statistical concepts to practical
problems in their disciplines |
Actual classroom exercises combined with testing as part of summative
evaluation of learning measures |
| Improve integration of statistical content throughout curriculum |
Analyze syllabi and interview faculty before and after for integration |
| Reduce duplication in courses |
Analyze syllabi and interview faculty regarding duplication |
| Produce materials that will prove valuable to other Universities |
Conduct evaluation procedures at Radford University |